1. Introduction
According to PEW Research1, 96% of adults between 18–29 occasionally consult reviews before making a purchase. But does this mean that higher ratings result in more product sales? Specifically, what do higher ratings indicate for video game sales? Maybe higher ratings lead to more game sales. But could some more obscure games with a dedicated group of followers receive higher ratings than popular games with significant sales volume? I am also curious whether there has been an increase in the production of games in recent years and, if so, what effect this increase has on the quality of games based on review scores. Is it possible that an increase in the number of games results in review scores decreasing with the oversaturation of video game releases?
In this project, I plan to use Metacritic’s user and critic review scores to see if there is a correlation between the scores of a game and its overall sales. I will be joining the review data with sales data obtained from VGChartz.
2. Data
This project uses two primary sources of data: Metacritic’s game critic and game player review scores, and VGChartz’s video game sales data.
2.1 Review Scores
I collected data from Metacritic, which contained user (user score) and critic (meta score) review scores for each game. Metacritic is a popular website that aggregates reviews of media products. For this project, the data were scraped from the site and stored in a comma-separated values (CSV) file. The dataset includes details like the game title, platform, publisher, release date, summary, meta score, and user score.
2.2 Video Game Sales
The website VGChartz provides sales data about the number of units of each game/platform combination sold. This dataset includes the title, platform, publisher, sales by region (North America, Europe, Japan, other), and total worldwide sales.
2.3 Combining Reviews and Sales
Since both datasets included the same game title multiple times based on platform, I merged them using both the title and platform columns. This allowed me to connect review information from Metacritic to the corresponding sales data from VGChartz.
3. Analysis
3.1 Video Game Ratings and Sales
I wanted to find out whether games with higher reviews sell more. I started by examining the distributions of meta scores and user scores across all games. Both scores are on a 0–100 scale, with higher values indicating better reviews.
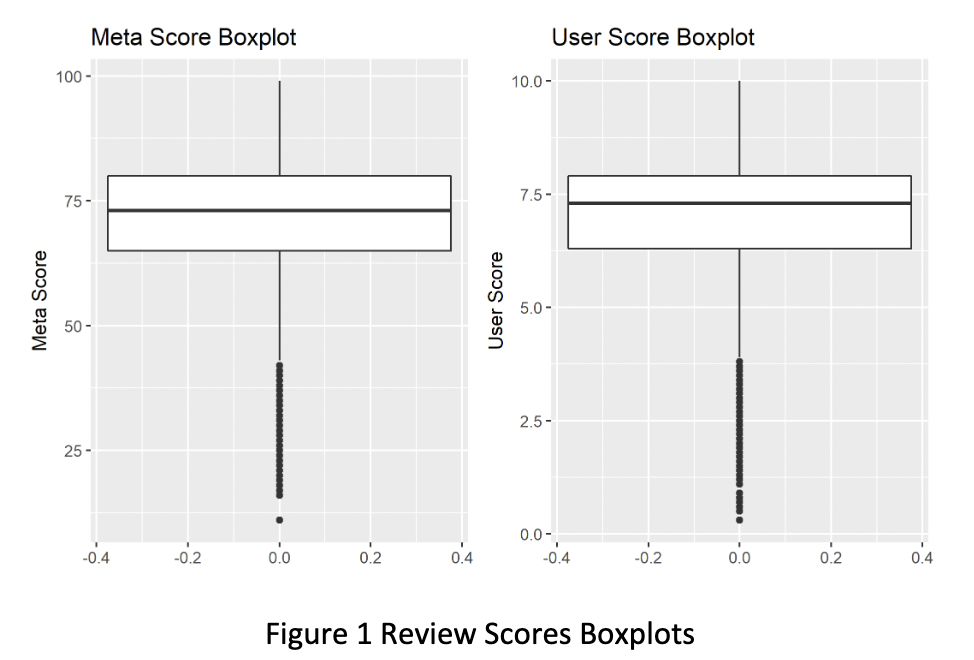
The boxplots in Figure 1 show that critic scores are generally higher than user scores, but both have a wide range. This may suggest that critics rate games more favorably overall, but users may have stronger negative opinions for certain titles.
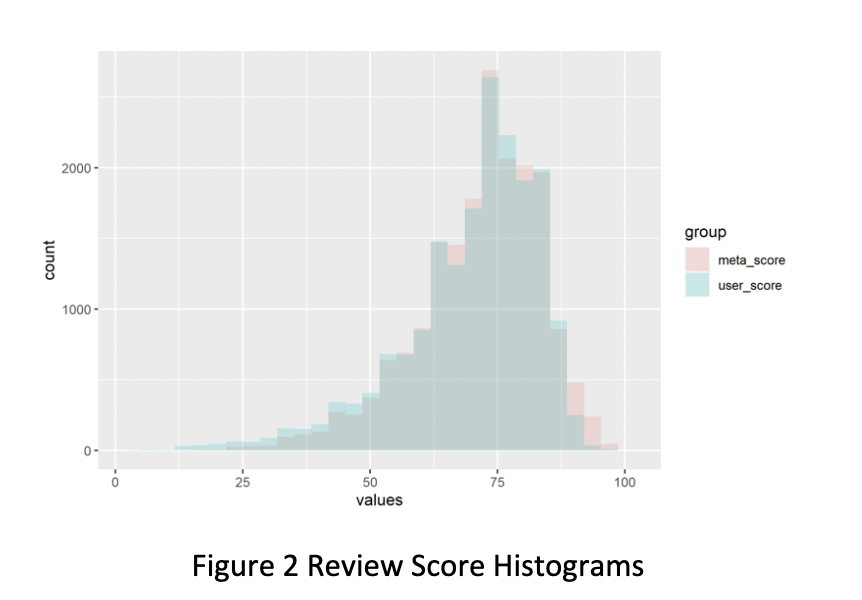
Figure 2 illustrates that both critic and user scores are slightly left-skewed, with many games receiving mid-to-high review ratings. This implies that only a small proportion of games are rated poorly.
3.2 Video Game Publishers
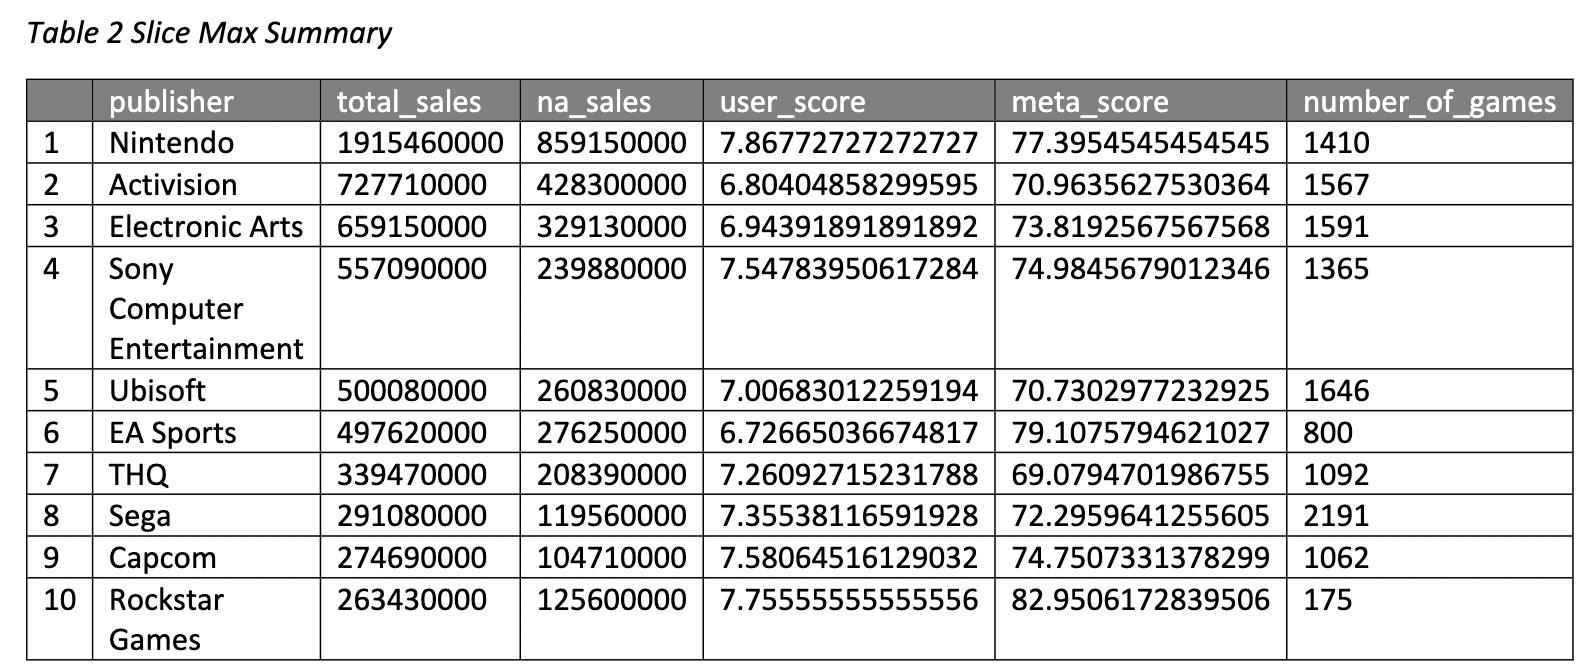
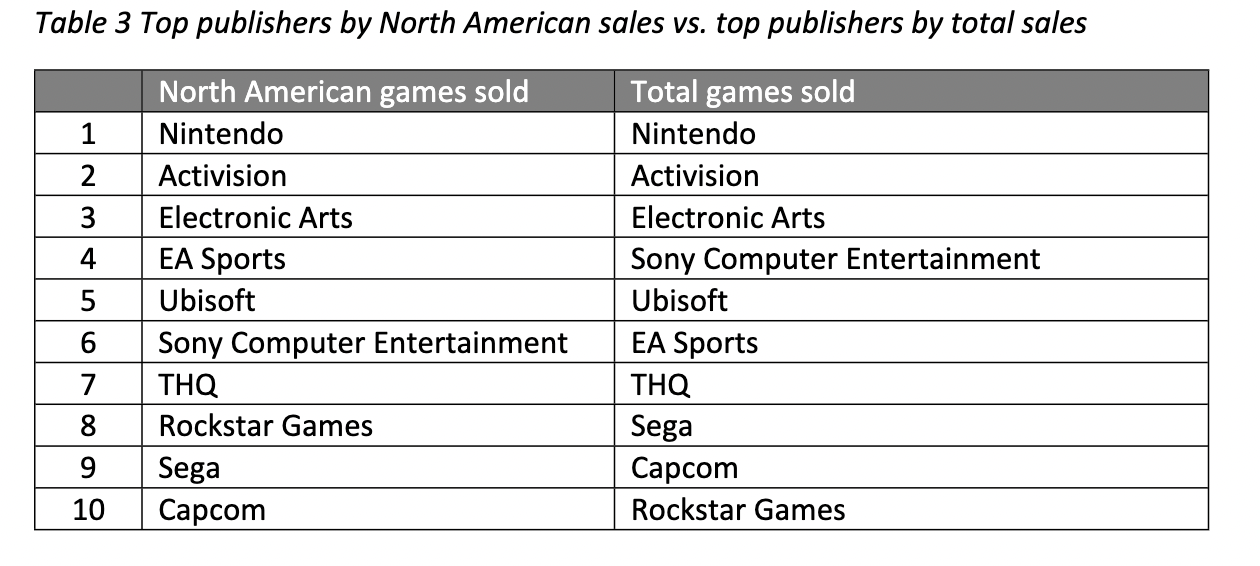
To find out which video game publishers have the highest sales, I aggregated the data by publisher and calculated the total sales across all their titles.
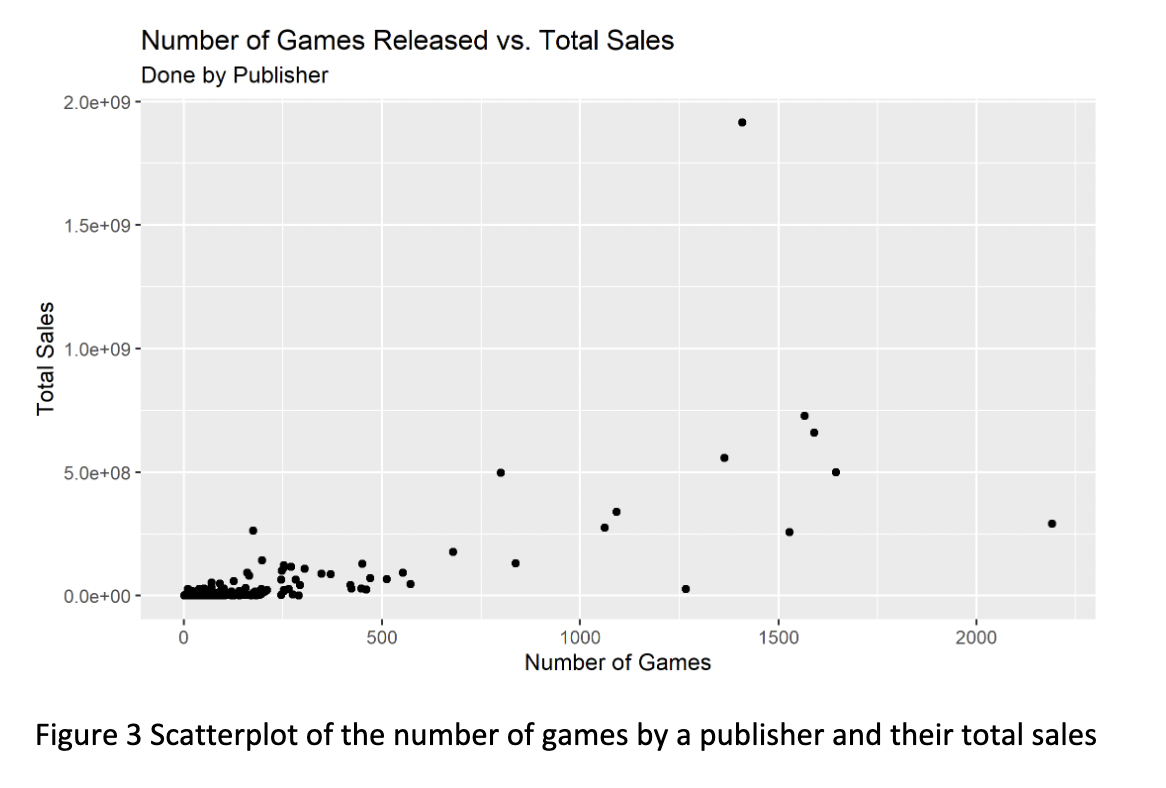
Figure 3 shows a positive relationship between the number of games published and total sales. This makes sense because publishers that release more games are likely to sell more overall. However, some publishers have higher sales despite releasing fewer games, suggesting that certain titles are extremely successful.
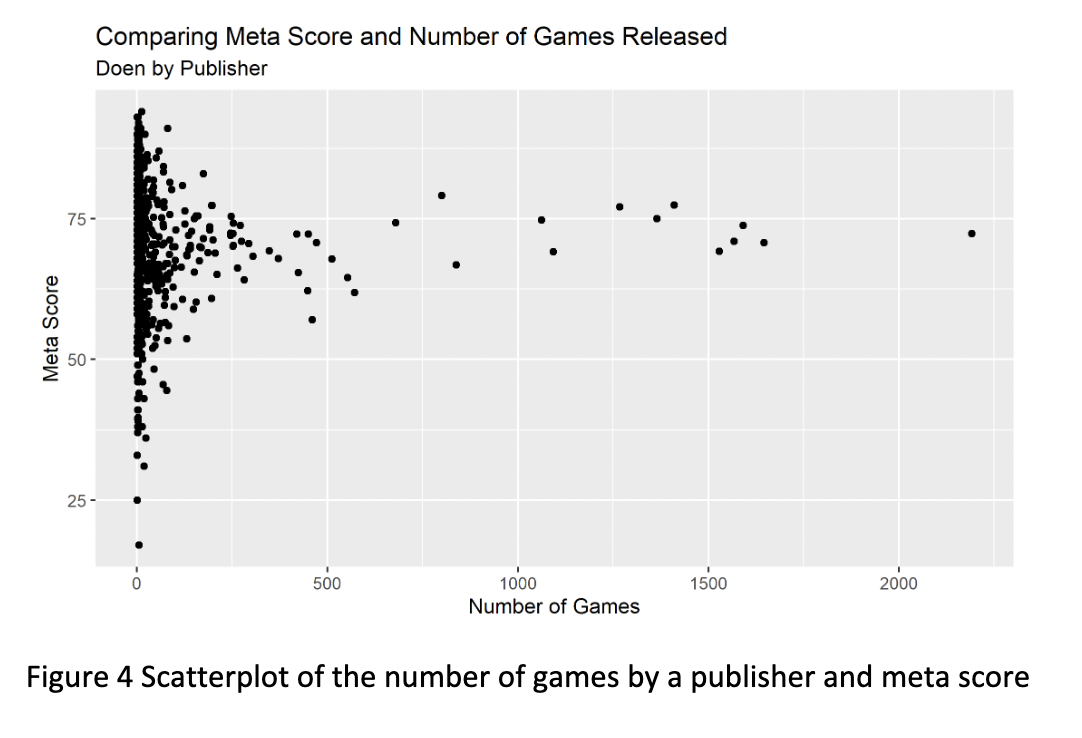
Figure 4 shows that there is little correlation between the number of games a publisher releases and their average Meta score. Some publishers with many releases have average scores around the middle, while others with fewer releases achieve higher averages.
3.3 Release Date
To determine how sales, number of games released, and review scores have changed over time, I examined how these variables vary by release year.
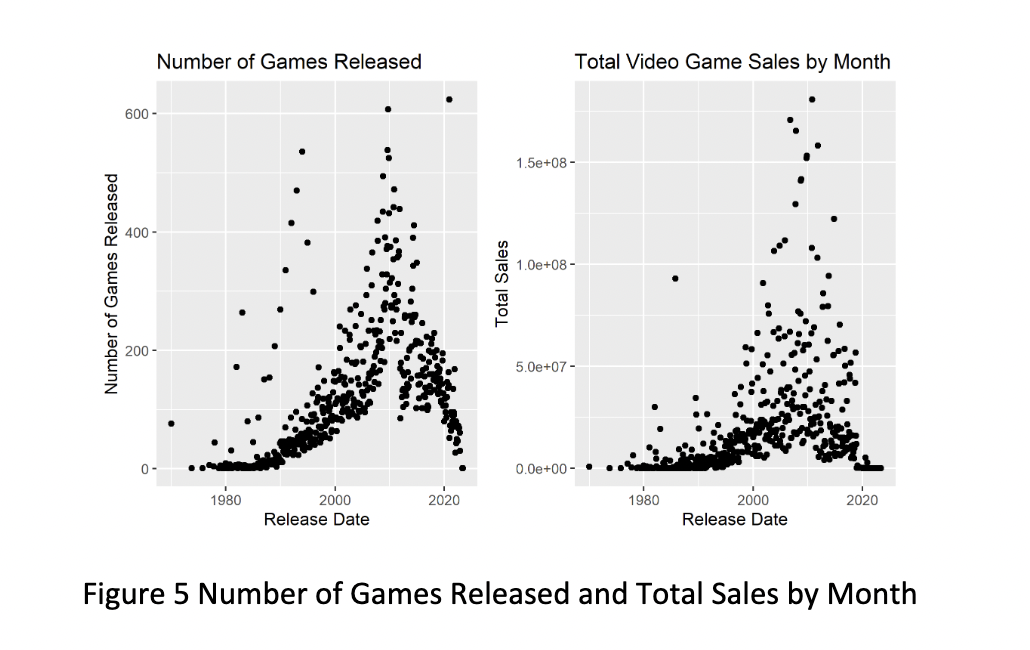
Figure 5 shows that the number of games released per month tends to spike in November and December, coinciding with the holiday season when game sales are highest.
totalsales_scatter.png)
Figure 6 illustrates that total sales have fluctuated over the years, with some of the largest spikes occurring around major console releases.
reviewscore_releasedate.png)
Figure 7 shows that review scores have remained relatively consistent over time, suggesting that quality is not necessarily decreasing even though more games are being released each year.
4. Conclusion
In this project, I analyzed video game sales and review data to explore how ratings relate to popularity and publisher output. Overall, the results indicate that although higher-rated games tend to have good sales, there is no guarantee that critical acclaim translates directly into higher revenue. Large publishers with many releases account for the bulk of total sales, but smaller developers can still achieve strong ratings with fewer titles.
The analysis also shows that release timing plays a major role in sales performance, with the most successful games being launched during the holiday months. While the number of games being released has increased in recent years, average review scores have not declined significantly, suggesting that the quality of games has remained fairly stable.
Future work could explore additional variables, such as genre or platform-specific factors, to provide a deeper understanding of what drives success in the gaming industry.